
The NBA Combine, Correlation, and Tryouts: Individuality Matters!
/
The NBA Draft Combine is taking place in Chicago, IL, this week, and while it may not garner the same amount of hype as the NFL Combine, it does help determine the fate of the young men participating in the NBA Draft in June. And any time there is testing, there are lessons to be learned about measurement and evaluation.
Are we testing these NBA hopefuls in what matters? Do the test results correlate to on-court performance? And what lessons, if any, can we learn when it comes to tryouts at the youth and high school level?
Measuring Up for the NBA
Let’s start with the basics. Similar to the NFL Combine, college basketball players are invited to participate in the multi-day protocol that includes: physical measurements, athletic tests, medical exams, interviews, shooting drills, small-sided drills (fast-breaks, weaves, three-on-three), and five-on-five drills and scrimmages in front of NBA coaches, general managers, and scouts. About 60 players are invited to go through the evaluation process, (though similar to the NFL Combine, not all players accept the invitation or do not fully participate in the testing).
Here is a list of the 8 physical measurements and 6 athletic tests:
Body size (formerly called anthropometrics—the measurement of the size and proportions of the human body) including height with shoes, height without shoes, wingspan, weight, standing reach, body fat percentage, hand length, and hand width
Standing, countermovement vertical jump
Maximum vertical jump with a running approach
Bench press max reps at 185 pounds
3/4-court (75 feet) sprint time with splits (equivalent of the NFL 40-yard dash)
Lane agility—the 4 corners drill, running, shuffling, and backpedaling around the lane
Reactive shuttle run

Compared to the scientific papers published on the NFL Combine—some which were highlighted in a previous article—there are very few publications on the utility and predictability of the NBA Combine. Below is a lay summary of the only paper, to my knowledge, that specifically examines the predictive validity, or value, of the combine with future NBA performance.
Predictive Validity Study
In this study—Predictive Validity of National Basketball Association Draft Combine on Future Performance, by Teramoto et al—the researchers used data from 234 of the 1092 players who participated in the NBA Combine from 2010-2015. The study then relates that player data to subsequent on-court NBA performance in each participant's first and third years, using principal component analysis: a statistical analysis that finds the main or principal components of a dataset with a lot of variables.
Three main components, or sub-scales, were identified within the combine data:
Length-size (height, standing reach, weight, wingspan, hand length, hand width)
Power-quickness (standing vertical jump, maximal vertical jump, ¾-court sprint, lane agility, body fat %)
Upper-body strength (bench press)
Again, the researchers correlated each of the individual tests and the three principal components listed above with various measures of on-court NBA performance that any hoops stats/data analytics nerd would be familiar with including: Player Efficiency Rating (PER), Offensive Win Shares (OWS), Defensive Win Shares (DWS), Win Shares (WS), Win Shares Per 48 Minutes (WS/48), Offensive Box Plus/Minus (OBPM), Defensive Box Plus/Minus (DBPM), Box Plus/Minus (BPM), and Value Over Replacement Player (VORP).
(Hands on my shoulders + whistle sound) Let’s take a 20-second timeout for a quick lesson on correlation. Correlation is a common statistic. Heck, we throw the jargon around all the time: “Vertical jump is correlated with performance” or “Your squat is related to your vertical jump.” From these examples, it should be evident that correlation is the statistic used to assess the magnitude or strength of the relationship between two variables: the correlation between variable A and variable B. If you measure two things that can be quantified on a continuous scale—height, vertical jump, hot dog consumption, etc.—you can calculate the correlation statistic. It could be the correlation between body weight and pull-ups, or the correlation between vertical jump and 10-yd dash, or the correlation between bench press and push-ups.
If we enter the data and run the stats, it will spit out a value called r, or the correlation coefficient. This number, for example r= 0.33, ranges in magnitude from 0 to +/-1.0. Yes, it can be positive or negative—but it can never be greater than 1. There’s no such thing as a correlation of 1.3 or 4.8!
A correlation of zero (r=0.00) means there is no relationship whatsoever. A correlation of 1.0 (r=1.0, again positive r=+1.0 or r= -1.0) is a perfect relationship between variable A and variable B. As variable A goes up or down by 1 unit, variable B behaves in the same way. Now, very few relationships among human traits are perfect. It was mentioned earlier that the magnitude ranges from 0 to +/-1—let’s say this is the strength of the relationship. Most researchers agree that a correlation between 0.00 and 0.30 is low or weak; correlations between 0.30 and 0.60 are moderate; correlations between 0.60-0.80 are moderately strong; and correlations >0.80 are strong—we’ve got something going on, let’s pay attention here.
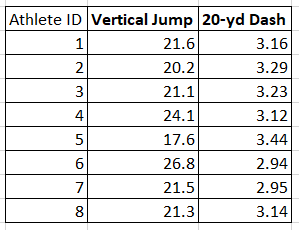
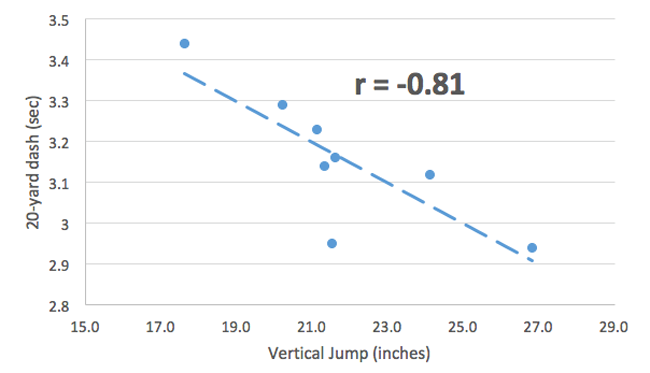
If you are like me, a picture is worth a thousand words and correlations can be much easier to visualize and understand from a scatterplot of the data. In the example below, I show data from a small group of 8 athletes who performed both the vertical jump and ran the 20-yard dash. I then plot the data and had a computer program calculate the correlation. As you can see, the correlation is strong and inverse—that is, the higher you jump, the faster you run.
Now, with an understanding of the statistics used in the study we are reviewing, let’s get back to the results. In general, most correlations between individual tests and the three principal components or Combine sub-scales (length-size; power-quickness; upper body strength) were low (r<0.30). In year 3, the individual Combine tests for anthropometrics (body size)—including height without shoes, standing reach, weight, wingspan, and hand length—as well as the Combine subscale of length-size, had moderate correlations (r = 0.31-0.54) with defensive performance quantified by Defensive Box Plus/Minus only. In other words, the taller, longer, and bigger players tended to have better defensive performance. Additional analysis using advanced statistical analysis showed length-size was a predictor most significantly associated with future on-court performance, including Win Shares, Box Plus/Minus, and Value Over Replacement Player; however, the strength of the relationship was still low.
The researchers concluded that the NBA Draft Combine has some value for predicting future performance of players, but let’s hit the brakes and consider a few things before taking this conclusion for face value.
A Few Individual Case Studies

As noted above in the review of the study, most correlations were low, with a few being moderate. At most that means there will be some athletes who score very well or very poor on the Combine tests and it is not related to on-court performance as exemplified in the two case studies below.
In 2013, 6’5” DJ Stephens of Memphis University displayed an eye-popping maximal vertical jump of 46 inches at the combine! He also had the fastest time at the in the ¾- court sprint. But he went undrafted, played overseas, and held a 10-day contract with the Milwaukee Bucks in March of 2014, playing 15 minutes in 3 games.
In 2007, a lanky ectomorphic 6’10” 215-pounder lay on a padded lifting bench, raised his arms up to a 7-foot barbell with 185-pounds of weight on it and...did not complete a single rep on the bench press! Zero! Goose egg! Nada! A string bean weakling who has gone on to be an NBA Champion, All-Star, MVP, and scoring champion! His name is Kevin Durant.
In other words, when it comes to correlation, we’ve got to read beyond the headlines. Just because an athlete performs well in the combine does not necessarily mean he’ll be a star in the NBA—and just because an athlete bombs the combine doesn’t mean he won’t excel at pro basketball! (Although, it is worth mentioning that developing more upper-body strength would likely help K.D. become an even more-dominant player, and basketball athletes shouldn’t neglect the bench press simply because he couldn’t bench.)
Talent Evaluation and Selection: A Multi-Factorial Approach
In my previous article on the NFL Combine, I mentioned the importance of considering multiple factors beyond the physical domain of sport performance to also include technical, tactical, and mental domains when evaluating and developing talent. Indeed, just like we evaluate students on not just one subject but as a whole (mathematics, science, literature, social studies, physical education, art, etc.), we also need to take a similar approach to evaluating athletic talent.
We all know an athlete who has incredible combine numbers but can’t shoot, makes bad decisions, and has a poor sports IQ or is a “head case” with poor mental skills. Thus, the evaluation and the development of the young athlete needs to take on a holistic approach, which is where the “athlete report card” comes into play.
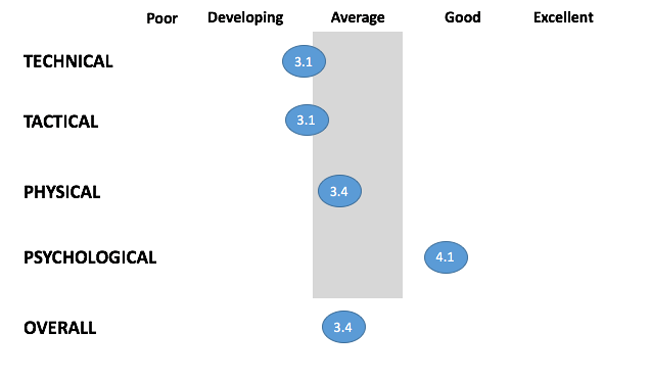
Similar to the NBA and NFL in their overall evaluation of prospects, it is important to recognize all the different facets of performance when assessing a young player and when designing programs to improve performance in individual athletes.
Individuality Matters!
The lack of strong correlation between combine tests and on-court NBA performance, as well as the multitude of factors that can influence an athlete’s performance, reminds me of a book called The End of Average by Todd Rose. In this book, the author examines the history of how we have come to be “averagearians,” critiquing the approach of measuring against the yardstick of averages. For example: in the mid-1950s, Air Force pilots were having trouble fitting into the cockpits of fighter planes—because every dimension of the cockpit was built based on the nine bodily dimensions of the average pilot, but nobody is exactly average.
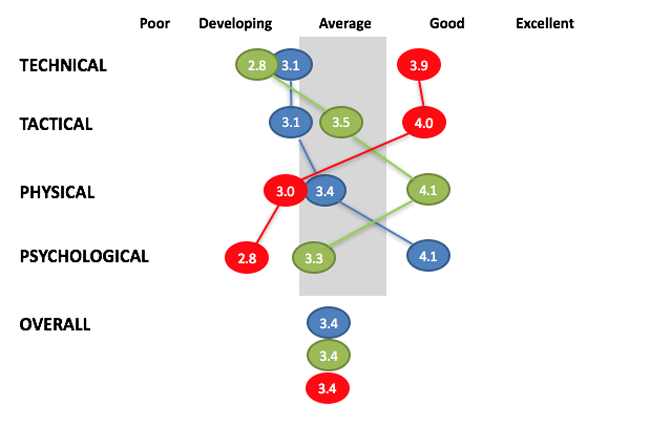
This one-dimensional thinking that everyone fits into this middle section we call “average” is a fallacy. Take the athlete report card example above: if Athlete A has a composite score of 3.4, think of all the combinations from the four dimensions that could tally a composite score of 3.4! A few are shown below—it’s not hard to see that these are entirely different athletes. And what’s more, each of the individual measurements consists of several separate factors, and consider all the possible variations within and across dimensions of performance. This is why it’s very important to understand that all human characteristics, such as intelligence, size, and athleticism—and ultimately performance—are complex, multidimensional traits.
A Final Note: Lessons for Youth and High School Coaches—The Tryout
A lesson from the NBA Combine and the points considered here can be related to the anxiety-ridden tryout process that occurs across the American youth and high school sports landscape on a seasonal basis. Many adults have expressed their thoughts and opinions about tryouts either on the sidelines, in line at the coffee shop, or online (social media, blogs, etc.).
I have been through it as a parent, coach, and an expert in youth sports. I wish (and hope) that we could change the youth sports culture and the accessibility to sports at all levels, but the reality is that right now there are tryouts occurring where kids will get cut from a team or program based off the decision of an adult—often based on only subjective data, if any at all.
For the young athlete, another important consideration that plays into tryouts and the selection process is the “pathway principle,” which was also highlighted in The End of Average and is also a major tenet of Long-Term Athlete Development (LTAD). Normative thinking leads us to believe that certain milestones must be met at certain ages. Think about the age at which walking occurs, and the tremendous variability at which age it occurs, and the pathway of how babies get there—we have crawlers, scooters, non-crawlers, and everything in between. But in the end, everybody walks! In youth and high school sports, we also see several developmental pathways, especially between early and late maturers during adolescence.
I certainly don’t know what the best solution is to remedy this matter, but I hope that the reader can use some of the insight from this blog to better formulate a sound decision-making process when it comes to combine tests and tryouts in youth sports—realizing that quantifying and predicting human performance is much more complex than a simple battery of physical tests.
“You have your way. I have my way. As for the right way, the correct way, and the only way, it does not exist.”
Join hundreds of thousands of coaches and athletes using Volt's intelligent training system. For more information, click here.
Learn more about Dr. Eisenmann | @Joe_Eisenmann
